I was giving the Magento Performance and Optimization for System Administrator’s course today and I said something that is either borderline brilliant, stupid, or common knowledge. What I said was something along the lines of “finding performance problems is about finding a) correlations, or b) deviations“. In other words, a big part of determining a performance problem, especially when using instrumentation data as opposed to reviewing code, a prime goal is to find data that correlates or deviates.
To illustrate this I rendered 4 charts top illustrate what I meant.
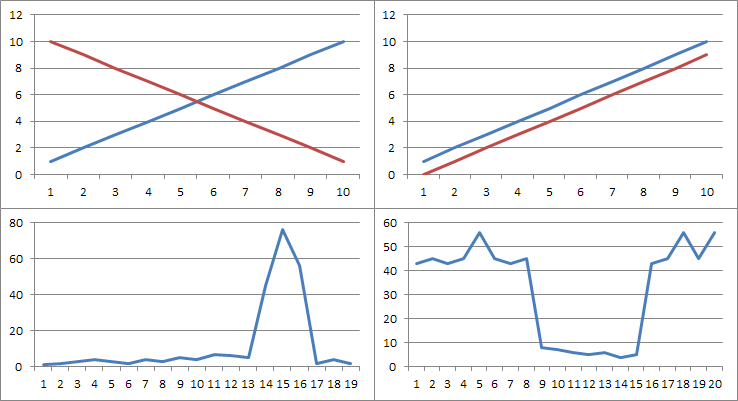
What I mean by this is that when you are determining performance problems whose cause is not readily apparent you should be looking for data that correlates either inversely or proportionally (top row) or deviates (bottom row).
What do you think? We must always grant that there will be cases where this is not true. However, it seems that it many scenarios finding either a) correlating data, or b) deviating data gets you about 3/4 of the way to discovering the source of a performance issue.
Comments
No comments yet...